Dateiname
Figure 2.JPG.png
Beschreibung
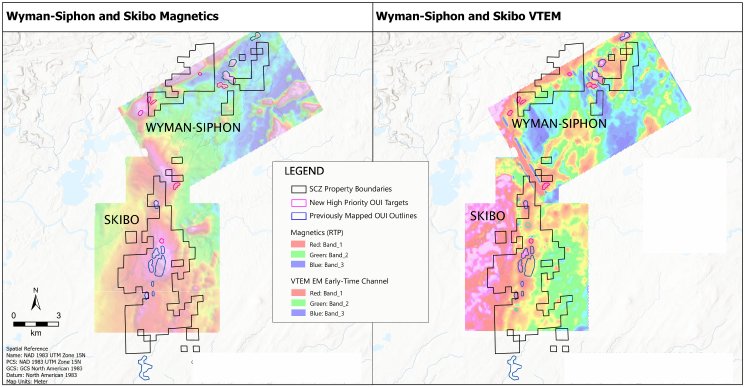
Figure 2. Side by side maps of the magnetics (left) and VTEM (right) over the Wyman-Siphon and Skibo properties. New OUI targets (pink polygons) as well as historically interpreted OUI (blue polygons) are shown.
Copyright
Swiss Resource Capital AG
Herausgeber

